How does funding stack up against the OECD?
05 April 2017 | news

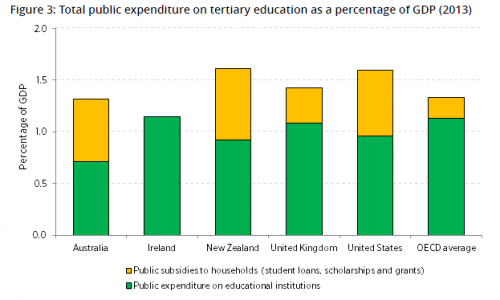
A recent media story claimed, “New Zealand devoted a higher proportion of its total public expenditure to tertiary education than any other country in the OECD.” [1] But how does government expenditure actually stack up against the OECD average?
While New Zealand spends a relatively high proportion of GDP on tertiary education overall, 20% of this expenditure goes directly to students, for example to student loans, scholarships and grants, rather than to the organisations themselves for teaching and learning.
As highlighted by the Ministry of Education, “Student loans in New Zealand play an important part of the public expenditure on tertiary education. When we exclude the public subsidies to households, which include student loans, scholarships and grants, New Zealand's public expenditure on tertiary education as a percentage of GDP (0.9%) was below OECD average (1.1%).” [2] [3]
This funding is spread across New Zealand’s highly diverse tertiary education landscape, which includes 16 institutes of technology and polytechnics, 3 Wānanga and around 240 publicly-funded private training establishments, as well as 8 universities.
[1] Stuff, 9 March 2017: “Low funding blamed for New Zealand universities drop in global rankings” http://www.stuff.co.nz/national/education/90158257/low-funding-blamed-for-new-zealand-universities-drop-in-global-rankings
[2] Ministry of Education, February 2017. Total Public Expenditure on Education indicator.
https://www.educationcounts.govt.nz/statistics/indicators/main/resource/2039
[3] OECD, 2016. Education at a Glance 2016 – OECD Indicators. Table B2.3. http://www.oecd.org/edu/education-at-a-glance-19991487.htm