Student Finance in the University Sector: Never Mind the Quality – Feel the Price
17 April 2012 | publications
Speech to the Conference on the Funding of Student Finance, IPS, School of Government, Victoria University of Wellington, 18 April 2012
Stuart McCutcheon, Vice-Chancellor of The University of Auckland
Stuart's address is available for download: Student Finance in the University Sector: Never Mind the Quality – Feel the Price
Introduction
The issue of how and to what extent the nation should invest in student participation in the university (and wider tertiary [1]) sector has for many years been the subject of controversy, argument and on occasions (mainly fee-setting occasions) downright abuse. However, there is one issue on which we can presumably all find common ground, namely that the country needs high quality tertiary institutions. Thus the Tertiary Education Strategy notes that “High quality tertiary education is central to helping New Zealand achieve its economic, social, cultural and environmental goals” [2], a sentiment with which students, their families and their future employers would readily agree. It is instructive, therefore, to look at what is happening to quality, why, and what it means for the future of our university system and its students.
What is happening to quality?
This is a difficult question to answer because no university would sensibly acknowledge that the quality of its activities is declining and, if one looks at Annual Reports and other public information, the performance of our universities typically improves to a small degree each year. However, a different picture emerges if we look at international rankings. There is, of course, room to debate the extent to which the rankings are a proxy for quality, but the main drivers of them (e.g. numbers of award-winning, highly cited and international staff, peer and employer views, student: staff ratios, research income) are commonly accepted measures of quality in universities the world over.
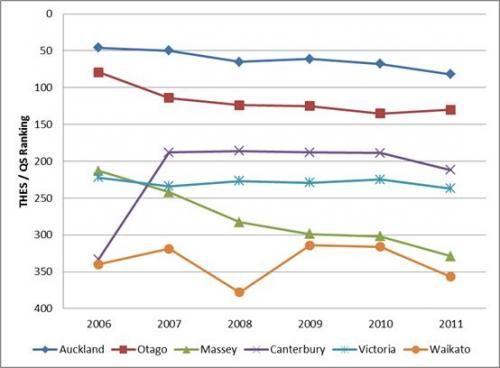
The harsh reality is that, at least as measured by international rankings, the New Zealand system is gradually falling behind the rest of the world. As Figure 1 shows, the world rankings of our universities have generally been declining in recent years, with no New Zealand university currently placed in the top 50.
It is important to appreciate that the ranking system referred to in Figure 1 is the one that is most generous to the New Zealand universities. If one looks at other systems such as Academic Ranking of World Universities (formerly the Shanghai Jiao Tong ranking system), most of the New Zealand universities are ranked below 400 with none above 200.
This is sometimes written off a being just a small country problem, but that is not the case. Denmark, Singapore, Switzerland, Ireland, Belgium and Hong Kong, all countries with populations not vastly different to those of New Zealand, each have at least one, and typically several, universities ranked higher than the highest of the New Zealand universities.
Figure 1: Rankings of New Zealand universities in the Times Higher Education/QS system 2006 to 2011.
Why are our rankings in decline?
The apparent paradox of (gradually) improved institutional performance but declining rankings in the New Zealand universities – one that often puzzles our alumni and supporters - is readily explained. As the QS report on world rankings in 2011 noted, “While New Zealand institutions have tended to perform well in the QS World University Rankings® since their inception in 2004, this year’s result continues a pattern from last year where the system appears to be losing ground as global competition in higher education increases”. John Molony, Vice President at QS, commented at the time, “The QS ranking result monitors an institution’s performance against all others and not simply what occurred at the university in isolation. Even if New Zealand universities are maintaining their investment and performance or improving slightly this does not appear to be enough to keep up with the global pack in the current environment.”
Underinvestment in our university system
It seems intuitively obvious, given the relationship between cost and quality observed daily in our lives, that high quality universities cannot be achieved “on the cheap”. And analysis of the quality-cost relationship bears that out. Thus, for example, Jo Ritzen, former president of Maastricht University in the Netherlands, demonstrated in 2009 that the single most important predictor of the THES ranking was expenditure per student. Ritzen estimated that for Maastricht to rise from 111 to 100 in the 2008 THES ranking would require an additional investment per student of some US$7,840 on a base of $35,497 – a 22% rise [3].
The need to invest in quality can be illustrated more generally. As Figure 2 shows [4], there is an asymptotic relationship between the international rankings of universities and their total expenditure per student. The New Zealand universities (in this graph the only three in the top 200) clearly have very low levels of expenditure per student by world standards (they are at the far left-hand side of the graph). Also notable is the fact that none of the top 200 universities in the world has a higher ranking than the New Zealand institutions at the same or lower expenditure per student. In other words, and accepting the limitations of ranking systems, New Zealand has probably the most efficient university system5 in the world as measured by quality relative to cost.
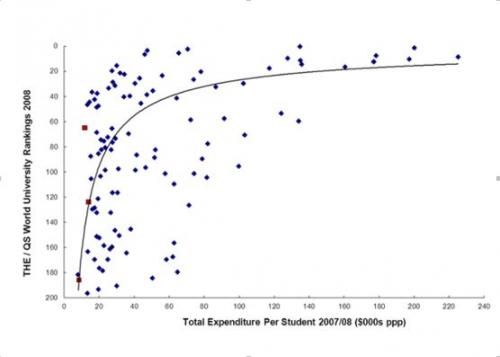
Figure 2: Relationship between the Times Higher-QS 2008 world ranking of each university (top 200 only) and its total expenditure per student (2007/8, expressed in US dollars at purchasing power parity or ppp). The New Zealand universities are shown as red squares. The line of best fit reflects a negative power relationship with 25-30% of the variation in ranking explained by variation in expenditure per student.
If we look at the institutions that represent our nearest competitors and against which we would most commonly benchmark ourselves (the Australian Group of Eight or Go8), then the relationship is even more striking, as shown in Figure 3 (in this case 2010 data).

Figure 3: Relationship between the Times Higher-QS 2010 world ranking of each Australasian university (top 200 in the world only) and its total expenditure per student (2010, expressed in US dollars at purchasing power parity). New Zealand universities are in red, Australian universities in blue.
What are the implications of our decline in rankings?
This decline in rankings has serious implications for the New Zealand universities. The willingness of international organisations (private and public) to partner with us is driven partly by our international rankings and associated reputation. So too is the willingness of alumni and donors to invest in us. Perhaps most worrying is the impact that declining rankings have on the willingness of international students to study at the New Zealand universities when they have options of higher ranked universities close to home. Rankings are the best proxy international students have for quality, and they are key drivers of decision-making by those students and their families. Thus, if the country genuinely wants to double the export education sector, as has been proposed by the government and others, it will be shooting itself in the foot if it continues to allow rankings to slide. The slide may also have an impact on able and well-off domestic students who are increasingly also using rankings to determine whether they should stay in New Zealand or study at higher ranked universities, for example in Australia.
Why do our universities invest so little per student?
Given that universities are not profit-motivated, their expenditure and income are highly correlated (the difference being their operating surplus, typically around 3% of revenues, which is ploughed back into capital development). Thus the reason they invest so little in their students (and other activities) is that their income is so low. In short, the public policy environment in New Zealand precludes the universities expending more per student and thus raising quality because it severely constrains the ability of universities to raise revenues. And, as will be demonstrated, student financing issues play a key role in that process.
As Figures 2 and 3 show, quality (as measured inversely by rankings) is correlated with total expenditure per student, and our expenditure per student is very low. The New Zealand problem is exacerbated by the fact that in many public systems governments invest directly in the capital development of universities whereas in this country universities must fund such developments from free cash-flow [6]. This effectively reduces the real operating expenditure per student even further.
There are seven major sources of revenue which universities generate to support their expenditure. By way of example, and fairly typical of the universities in general, their contribution to the University of Auckland budget in 2011 was:
- The government tuition subsidy (31%), which at least over the last decade has increased at a rate about half that of the increase in university costs (typically 4-5% per annum, mainly in people costs) and thus has declined, per student, in real terms. Prior to 1999, it did not increase at all for a substantial period.
- The Performance Based Research Fund (8%), which is not cost-adjusted and whose value thus declines in real terms year on year.
- Domestic tuition fees (15%), which are constrained by government policy at a level well below that required to compensate for the under-investment by government in the first two items.
- Domestic public good research (12%), which is also not cost-adjusted and declines in real terms, and a significant proportion of which has been sequestered to protect the Crown Research Institutes.
- International tuition fees (8%), which are (other than through the vagaries of immigration policy and the like) not restricted by public policy.
- Commercial and international research income (13%), likewise largely unrestricted by public policy.
- Other revenue (13%) including provision of services, philanthropy and sundry sources. Unrestricted by public policy except in regard to student services levies.
Thus about two-thirds of the universities’ revenues (more in some cases) are constrained by public policy, which constitutes the single biggest risk or constraint to the universities as they strive to increase the quality and international reputation of their institutions. To put it simply, we do not increase revenues per student, and therefore expenditure per student, and therefore quality (at least not at the rate of our competitors) because we are not permitted to.
As the curvilinear nature of the quality-expenditure relationship in Figure 2 indicates, the problem is not simply one of pouring endless amounts of money into universities. There is clearly a “sweet spot” [7] beyond which additional investment will produce little gain in quality. However, it is equally clear that the New Zealand universities are a long way from hitting the sweet spot.
The impact of student financing issues
The inability or unwillingness of successive governments to invest in universities at an appropriate level or to allow costs to be passed on to students is clearly related to student financing issues. This is evident in the fact that much of the political and public relations effort by various stakeholder groups is directed at ensuring that someone else pays. The over-arching shared aspiration of a high quality university system is rarely part of the debate and so comes increasingly under threat.
It is well established that a university qualification confers a significant private good. Estimates vary, but the OECD suggests that a person with a tertiary education can expect to earn on average over 50% more in their lifetime than one who completed their education at upper secondary level. [8] Tuition fees in New Zealand (averaging US$ 3000 in 2008-9) are also low when measured against the countries whose university systems we typically benchmark (Canada (US$3500), the UK and Australia (US$4-5,000) and the USA (US$6,500)). [9] Thus a university education in New Zealand offers a high private benefit: cost ratio.
Despite this, the New Zealand environment is one that strongly favours reducing or constraining the cost of education over raising quality. As Table 1 shows, New Zealand is unusual in having a high proportion of expenditure on student financial aid (particularly loans) and a low proportion on investment in the institutions, compared to countries we typically benchmark ourselves against. The interest-free loans are a particular problem in this regard. If governments allow universities to increase tuition fees, those fees will more or less automatically go on the loan book and the government will essentially pay a portion of them anyway. A government seeking to restrict expenditure is thus motivated both to limit its own investment in the sector and to restrict the ability of the institutions to pass on costs to the other major beneficiaries of the system, the students.
Table 1: Distribution of public spending on student financial aid and funding of institutions (2008) [10]
Country
% Public spending on tertiary education allocated to:
New Zealand
Student financial aid
Grants: 11%
Loans: 31%
Total: 42%
Funding of institutions: 58%
Australia
Student financial aid
Grants: 11%
Loans: 21%
Total: 32%
Funding of institutions: 68%
Canada
Student financial aid
Grants: 3%
Loans: 12%
Total: 15%
Funding of institutions: 84%
United Kingdom
Student financial aid
Grants: 4%
Loans: 28%
Total: 32%
Funding of institutions: 68%
United States
Student financial aid
Grants: 5%
Loans: 15%
Total: 20%
Funding of institutions: 80%
Is the high level of student support at the expense of quality justified?
The tension between accessibility, quality and cost of a university education is not a new one. As Clarke Kerr noted fifty years ago, “There is the urgent issue of how to preserve a margin for excellence in a populist society, when more and more of the money is being spent on behalf of all of the people. The great university is of necessity elitist - the elite of merit - but it operates in an environment dedicated to an egalitarian philosophy. How may the contribution of the elite be made clear to the egalitarians, and how may an aristocracy of intellect justify itself to a democracy of all men?” [11]
The current arguments in favour of a low cost education system and high level of student support seem to be primarily that such arrangements encourage participation and that they ensure participation by those who are disadvantaged in socio-economic terms. Both arguments are spurious.
The first point to be made is that participation in the university system has been growing for a very long time, since well before the advent of significant tuition fees and student loans over the last two decades. Figure 4 illustrates this point, using headcount [12] data from The University of Auckland. Growth from the University’s founding in 1883 to the early 2000’s followed an exponential pattern of increase13, one that pre-dates and is apparently unaffected by changes to student financing over the last 20 years or so. The curve levelled out only when international student numbers fell in the early 2000’s due to damage to New Zealand’s reputation caused by the high profile failure of several private providers. Subsequently, our strategy of limiting entry to all programmes and the government’s later decision to cap EFTS ensured that numbers levelled off, but none of these factors reflects the alleged negative influence of tuition fees on the willingness of students to enrol. This is hardly surprising given that, as noted earlier, a university qualification confers a significant private good and students are bright enough to make rational decisions. Indeed, OECD figures across a very wide range of tuition fee structures show no association between the level of fee charged in each country and its participation rate in tertiary type A (mainly university) programmes. [14]
The second issue – that of assisting participation by students from low socio-economic backgrounds may have some merit although, regrettably, many such students are precluded from entering university by poor levels of achievement in the compulsory sector. However, the way to enhance access for students who are constrained by economic circumstances is surely to provide financial support for those students, not to constrain costs for all students at the expense of the quality of institution they will be able to attend, which is what happens now.
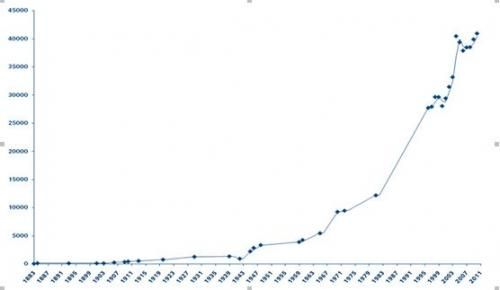
Figure 4: Student numbers (headcount) at The University of Auckland 1883-2011. Figures prior to 1983 are drawn from Keith Sinclair, A History of the University of Auckland, 1883–1983, AUP/OUP, Auckland, 1983; those post-1983 from University records.
What are our available options?
Although governments have been prepared to marginally restrict access to loans, they (and oppositions) know that the removal of the interest-free loan provision is likely to be political suicide. Having experienced free education, New Zealanders have an expectation that it should continue to cost as little as possible. Combined with the desire of political parties to stay or be in power, this has, at least to date, trumped the need to increase revenue or expenditure per student and the quality of our universities.
There has of course been some recognition of the importance of additional investment in universities – for example, the tripartite investment of the previous Labour Government and the diversion by the present Government of $55m from industry training to the university sector in 2011-12.But these attempts have been piecemeal and of limited impact on what is a significant under-investment. Meanwhile, our international rankings continue to fall.
If one accepts that the relationship between quality and revenue or expenditure per student is causal, then we have five options available to us:
- Maintain the current level of total public investment but reduce the number of students. This has been suggested on numerous occasions but has found no political favour. Indeed the recent history of the New Zealand university system has been the opposite – massively increased participation (e.g. Figure 4) financed in part by a reduction in real terms of per student investment.
- Increase the level of real public investment per student, contrary to the historical practice of the last three decades or more.
- Increase the contribution students are required to pay, giving the universities an opportunity to charge an appropriate price for a quality product. This would likely require a government to limit access to the student loan scheme, and would lead over time to a more differentiated university system.
- Change the balance of university activities. Absent the previous three options (which is the current position de facto), the universities could attempt to increase revenue per student, and thus rankings/quality, by changing the balance of activities in favour of those that are relatively unconstrained. This would require us to seek more international students (who generate a ca $7,000 per annum margin over equivalent domestic students), presumably as substitutes for domestic students (since simply taking on additional international students will add to our capital development costs and reduce the marginal benefits). It would also require us to seek additional research support, most logically from offshore since our ability to compete openly for research funds in New Zealand has been much restricted. However, our ability to take this approach is likely to be severely constrained, both by the fact that these revenue streams constitute only a small part of our revenue and by the influence of our already declining international rankings. Even if New Zealand universities were able to increase revenues per student and thus quality by shifting towards new revenue sources, they would have to achieve this by reducing their contribution to this country – because of the paradox that for New Zealand public universities it is the public-serving activities (domestic tuition and research) in which they have the greatest constraints. One assumes – or at least hopes – that this would be as unpalatable to voters as removing the interest-free loan provisions, though it is a choice they are rarely presented with.
- Accept that the quality and rankings of New Zealand universities will continue to decline. In this option, the universities retain their current balance of activities (i.e. those dominated by domestic teaching and research whose funding is controlled by government) and accept that their real revenue and expenditure will continue to decline, along with their international rankings. As a consequence, domestic students will see a slow but real decline in the quality of their teaching and learning environment, including in the quality of the teaching staff universities are able to attract and retain, and in the resources made available to them. The relevance and portability of the students’ qualifications will inevitably decline as well, and we are already seeing anecdotal evidence of high- achieving New Zealand school leavers deciding their futures might be brighter if they studied offshore. [15] International student enrolments will likely fall, support from alumni and donors will diminish, and international partners will be less willing to engage with our universities. If this is what the nation wants, in preference to the other four options, then we should at least have the courage to be open and honest about it. However, at the risk of stating the obvious, I do have to observe that it is an unacceptable option for those of us committed to creating great universities in the service of New Zealand.
The size of the problem
The effect of underinvestment in the New Zealand university system has been building up for many years. The size of the problem can be illustrated by asking the question, “How might we raise the income per student in New Zealand universities by 15% in order to support a significant lift in quality?” Note, by way of example, that the University of Auckland has an annual operating revenue of ca NZ$900m per annum. A 15% increase would take it to $1.04b per annum, still only 65% (dollar for dollar) that of the University of New South Wales or University of Queensland, with similar student numbers. Such an increase could be achieved by:
- Reducing the number of domestic EFTS by about 1,200 while holding public investment constant [16]
- Increasing the government tuition subsidy by 50%
- Increasing the average fee charged to students by 100%
Conclusions
Most of the debate about funding of universities and about student finance has focused on how to reduce the cost of education to students rather than on how to give them access to world class institutions. Issues of price (to the student and to the government) have dominated issues of quality.
These are complex issues that we as a nation need to come to grips with. Part of that must be accepting that the country cannot have, at the same time, the current participation rates, heavily constrained levels of government subsidy, low tuition fees and high quality. Something has to give. And until we truly begin to value a quality education over a cheap education, we will continue to preside over what one university leader [17] has described as “the glide path to mediocrity”.
References:
[1] My comments are directed only at the university sector but, at least in some cases, will likely be relevant to the wider tertiary sector
[2] Tertiary Education Strategy 2010-2015, Tertiary Education Commission.
[3] Ritzen J, 2009, A Chance for European Universities. Amsterdam University Press. ISBN 9789089642295
[4] Total expenditure per student was calculated as the ratio of operating expenditure from all sources to equivalent full-time students, expressed in US$ on a purchasing power parity basis. Data are derived from those top 200 universities in the 2008 THE/QS World University rankings that published expenditure and student numbers in their Annual Report or equivalent
[5] The New Zealand system is also unusual in that all eight universities provide a research-informed teaching environment, something we should continue to value if we genuinely desire an innovative society and economy
[6] Given the dreadful buildings that were commonly constructed on university campuses when the process was under central control prior to 1989 this is not an argument for direct government investment in facilities, but it might be an argument for a greater level of public and private investment in the operating position of universities to allow them to invest properly in quality infrastructure
[7] Juno, M. 2011. Public spending and university quality: is there a link?
[8] Education at a Glance. OECD 2011, p.138
[9] Education at a Glance. OECD 2011, Chart B5.2
[10] Education at a Glance, OECD, 2011, Table B5.3
[11] Clark Kerr, 1963. The Uses of the University. 5th edition Harvard University Press, Cambridge, Mass., 2001
[12] It is necessary to use headcount because EFTS are a relatively recent innovation
[13] For the mathematically minded, the log plot of student numbers over time has an r² value in excess of 0.95!
[14] Education at a Glance. OECD 2011, Chart B5.2
[15] Fairfax NZ news, 15 April 2012. “Top students turning backs on NZ”.
[16] The proportional reduction required is less than 15% because international students generate a much higher revenue per student than do domestic students who are subject to government price controls
[17] Richard LaRiviere, former President of the University of Oregon