Groundbreaking research by Woolf Fisher Scholarship recipients aims to transform New Zealanders’ lives
07 October 2022 | news
The three recipients of a 2022 Woolf Fisher Scholarship aim to transform New Zealanders’ lives with their groundbreaking research into Parkinson’s disease, cochlear implants for people with hearing loss, and the best ways to regenerate native forests.
Worth around $70,000 a year for up to four years, a Woolf Fisher Scholarship is one of the most prestigious and generous available to New Zealand students.
It supports recipients to undertake postgraduate research at the University of Cambridge in the United Kingdom.
Recipients are chosen for their outstanding academic ability, integrity, leadership and boldness of vision, their exceptional zeal, keenness and capacity for work, and their commitment to New Zealand.
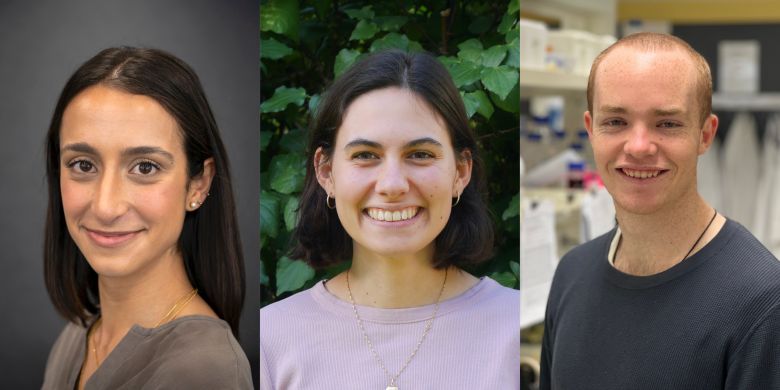
Sita Clark (pictured left), aged 26, will be studying for a PhD in Clinical Neurosciences, researching cochlear implants, a life-transforming technology for patients with severe to profound hearing loss.
“Hearing is fundamental to achieving human connection. Together with vision and touch, it enables communication and interaction with one’s community and environment,” says Sita.
“Nearly 20% of all New Zealanders are affected by hearing loss, with higher rates in males, Māori and the elderly. If left untreated, hearing loss is associated with increased rates of social isolation, dementia, cognitive decline and depression.
“In 2016, hearing loss was estimated to cost New Zealand $957.3 million a year and 23,130 disability-adjusted life years, a metric that quantifies the morbidity and mortality of a disease. Despite this significant disease burden and wider socioeconomic impact, there are no dedicated surgical otology [hearing] research institutes in New Zealand currently.”
Cochlear implants consist of a delicate silicone strip containing a series of electrodes that, once surgically implanted, stimulate the auditory nerve in response to sound and relay these messages to the brain. Sita’s research will aim to use advanced imaging techniques and 3D-printed models of the human inner ear to help progress towards customised cochlear implants prior to surgery and improved long-term surgical outcomes.
“It was through my Bachelor of Medical Science with Honours year at Waipapa Taumata Rau, University of Auckland and working with hospital patients with significant deafness that I realised how under-researched and poorly funded ear, nose and throat diseases are in New Zealand,” says Sita.
“In 2021, only 40 New Zealand adults received a single cochlear implant through the public health system, with no increase in government funding for this life-changing surgery in the preceding eight years.
“Through my PhD and subsequent clinical practice, I hope to increase the research and awareness of cochlear implant surgery in New Zealand, to help stimulate increased government funding through our public health system and ensure equitable access to this transformative surgery nationwide.”
As well as her first-class honours degree, Sita has a Bachelor of Medicine and Bachelor of Surgery from the University of Auckland. While there, she was awarded two Blues Awards for Service and Leadership and was one of the top achievers in the Faculty of Medical and Health Sciences, receiving numerous research scholarships and a Distinguished Graduate Award on completion of her studies.
Sita, currently a junior doctor at Auckland City Hospital, in 2019 founded and led a significant fundraising event called Thirtyeight-in-38 in support of CatWalk, New Zealand’s Spinal Cord Injury Research Trust.
She is a former student of St Peter's School in Cambridge, Waikato, and Tauranga Girls' College.
Nina de Jong (pictured centre), aged 23, will be studying for a PhD in Plant Sciences, researching successional theory and its potential application in regenerating New Zealand forests.
“Plant ecology endeavours to understand why plant communities assemble as they do, and a central process within vegetation assembly is succession, the species turnover at a site through time. Understanding the successional trajectory of a plant assemblage requires untangling which environmental influences are most important for different species’ performance and linking this to species’ functional traits.
“My Bachelor of Science with Honours research on regeneration failure of kahikatea, or white pine, in the Waikato region contributed to this body of research, demonstrating how hardy, drought-resistant tōtara may displace swamp-loving kahikatea on drained dairy farms.
“Current restoration practices in New Zealand, and in many regions internationally, are only loosely based on ecological understandings of how forests regenerate. Incomplete knowledges of long-term forest responses under different land-use legacies make a difficult task of accurately predicting successional trajectories at a specific site. As a result, our restoration practices are vulnerable to inefficient techniques, unsuitable species choices and wasted resources. These lead to poor outcomes and compromise the immense effort that communities take to care for land.”
Nina’s main research question relates to the interaction of active and passive regeneration.
Left to their own devices, plants alone recolonise disturbed and degraded sites, but when, and at which stages, are interventions necessary and what form should they take?
“Communities concerned with environmental restoration often want to re-establish forests that resemble historic, pre-degradation conditions. However, land-use legacies create conditions that may suit new assemblages. Land post-farming may not support the forests it once did,” says Nina.
“Useful ecological knowledge has the potential to be empowering for communities by facilitating people’s engagement in land stewardship. This work requires both excellent ecological expertise and a critical awareness of the politics and social injustice woven through land use and environmental issues. I would like to work at the nexus of climate change impacts, forest ecological theory and community conservation aims towards positive environmental outcomes for New Zealand.”
A New Zealand Dutch–Samoan, Nina says, “Conscientious, collaborative and well-designed ecological research has much to contribute towards environmental justice, and as Indigenous peoples worldwide have long recognised, social and environmental justice are the same issue.”
As well as her first-class honours degree from Waipapa Taumata Rau, University of Auckland, Nina has as Bachelor of Science from the university, where she was a high achiever consistently receiving ‘first in class’ awards and other prizes and scholarships.
She was a founding member and lead editor of the university’s Scientific magazine, in which students write about their research and scientific topics that interest them. Eminent British scientist, broadcaster and writer Professor Brian Cox has described the magazine as a superb example of excellent science communication.
Nina attended Epsom Girls Grammar School in Auckland.
Like Sita, Cameron Ryall (pictured right), aged 22, will be studying for a PhD in Clinical Neurosciences, in his case focusing on Parkinson’s disease.
“Currently, no treatment can slow the spread of Parkinson’s, a complex condition with multiple genetic and external risk factors,” says Cameron. “The only commonality between cases is the accumulation of the protein ‘α-Synuclein’, which incorrectly aggregates in Parkinson’s patients to disrupt cellular activities. One element α-Synuclein disrupts is the mitochondria, a cellular component essential to energy generation and cell survival.
“Mitochondria failure, when exposed to abnormal α-Synuclein aggregates, is thought to be a driving factor in Parkinson’s-related cell death. Extensive work has been done to understand this interaction, but it remains one of Parkinson’s biggest puzzles. Putting together this puzzle has excellent potential for treatments that can prevent cell death and the progression of Parkinson’s.”
Cameron is looking forward to learning skills he can bring back to New Zealand, including bioinformatics and network analysis, which he has already been studying.
“I want to continue developing these skills to apply a unique lens on biomedicine and neuroscience. Computational analysis of biomedical data is the future of medical science and will define precision medicine development. Being on the forefront of technology is important to me – machine learning and computational biology will usher in the next era of precision medicine and I want New Zealand to be a part of it.”
Cameron also wants to continue his involvement in New Zealand’s not-for-profit sector, having been a co-director of Youth Philanthropy New Zealand and now preparing to take a governing role with the organisation.
“The scientific community in New Zealand is sustained by the charities and institutions that provide funding and resources that facilitate research. Developing these institutions or founding new ones is a goal of mine to advance New Zealand’s scientific contributions,” he says.
Cameron is currently completing a Bachelor of Biomedical Science with Honours at Waipapa Taumata Rau, University of Auckland, having received a Bachelor of Science from the university.
He was awarded a 2022 University of Auckland Honours Scholarship and is a lead tutor in undergraduate teaching labs.
Cameron attended Wakatipu High School in Queenstown.
Commenting on the recipients of this year’s Woolf Fisher Scholarship, Sir Noel Robinson, chair of the Woolf Fisher Trust and the scholarship selection committee, says he is once again delighted with the calibre of those appointed.
“Since the scholarship programme was established in 2004, 90% of the scholars have completed their PhD successfully. This is a very high rate which reflects both the outstanding young people we select and the high level of support the Woolf Fisher Trust provides.
“I am confident Sita, Nina and Cameron will be just as successful and, like their predecessors, go on to make important contributions to New Zealand and internationally,” says Sir Noel.
Sir Woolf Fisher (1912–75) was co-founder of Fisher and Paykel and established the trust in 1960 to recognise and reward excellence in education.
Universities New Zealand – Te Pōkai Tara administers the Woolf Fisher Scholarship along with more than 35 others.
The opening date for the next round of applications is 1 April 2023 and the closing date is 1 August 2023. Details are available on the scholarship’s page on the Universities New Zealand website.