People who leave university without a degree – choice or failure?
28 August 2025 | news
By Chris Whelan, Chief Executive, Universities New Zealand
Each year at least 17,000 young people complete school and start a bachelors-level qualification at a university in New Zealand. Around 1 in 5 of them will leave that university within three semesters of starting – without completing their degree.
As a country, we assume that our universities have failed these young people. They are treated as a non-completion and a black mark for our universities. But, as a country, we don’t actually track these people. We have theories as to why they exit but, until now, not a lot of data.
We went into the Integrated Data Infrastructure (IDI) to see what it could show us. The results are, in a word, surprising!
A note about our data and our sample
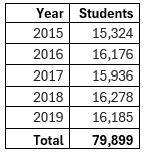
We looked at five consecutive cohorts of domestic school leavers who went direct from school into a New Zealand university with no gap year. The cohorts were students who started at university in one of the years 2015 to 2019 – 79,899 students in total over that five year period.
We chose this population because they were not impacted by subsequent factors that might have affected their decision to exit earlier – Covid-19, global recession, or the current cost of living crisis. The 2018 Census data also provides some useful insights about this population.
Our study only includes students who gained NCEA level 2 or 3 or University Entrance. It excludes students who have studied towards Cambridge, International Baccalaureate or any other alternative secondary school qualification. It also excludes students who started universities after a gap year as well as a small number of students who returned to secondary schooling and left school at age 22 or above.
We looked only at students who enrolled in Level 7 Bachelors level qualifications – even if they had initially enrolled at the university in a Certificate of Proficiency (CoP) programme. This means, for some students, that the first semester might have been a summer semester attempting a Certificate of Proficiency with a view to commencing degree-level studies at the start of what is normally the first semester of an academic year – February/March.
So, where did the exiting students go?
Of the 79,899 students in the five year period covered by our analysis, 14,097 (17.6%) discontinued studies at their original university during one of their first three semesters of study (18 months).
Using the Integrated Data Infrastructure (IDI) we were able to see what students were eight months after exiting the university they initially enrolled at. The results are shown below:
Table 1: Destination of students who exited and retention recalculated at different levels
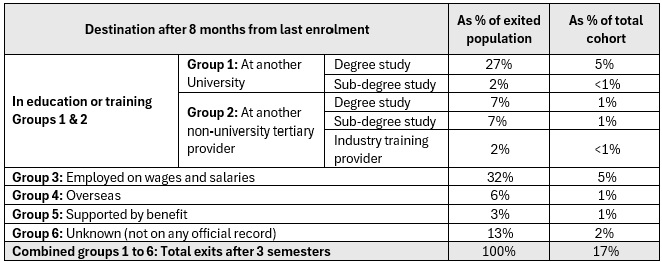
The students are clustered into six groups.
- 46% of students (groups 1 & 2) were in training or education with another provider. 29% had gone to another university and the other 16% to a non-university provider.
- 32% (group 3) were in employment.
- 6% (group 4) were overseas. We do not know what they were doing once they went overseas. They may have been on holiday, working, or studying abroad.
- 3% (group 5) were on a benefit (Jobseeker, health or disability, etc).
- 13% (group 6) did not appear on any official record. They were not on a benefit, employed, or in training. Note that this 13% is actually just 2% of all the school leavers who started university and is likely to be made up of a mix of people who, at the point in time we looked for them, were waiting to start work, taking a gap year, waiting to start studies elsewhere, etc.
Although 17% of students leave university within three semesters of starting, just over a third of them transfer to another university. Putting that another way, although the original university only retains 83% of their students, the university sector retains 88%, and the total who are still doing some sort of education and training is actually more like 92%. Just 8% leave education and training altogether.
The rest of this article goes deeper into the data to look for patterns and potential reasons as to why students exited their first university.
Timing of exits
Looking at the timing of when students exit, the largest proportion (59%) of those who exited (or 10% of those who start university) left at the end of the second semester – typically the end of their first full year of studies. By contrast 28% (or 5% of those who started university) exited at the end of their first semester and just 13% (or 2% of those who started university) exited at the end of their third semester.
Table 2 breaks this down in more detail.
Table 2: The timing and destination of exits
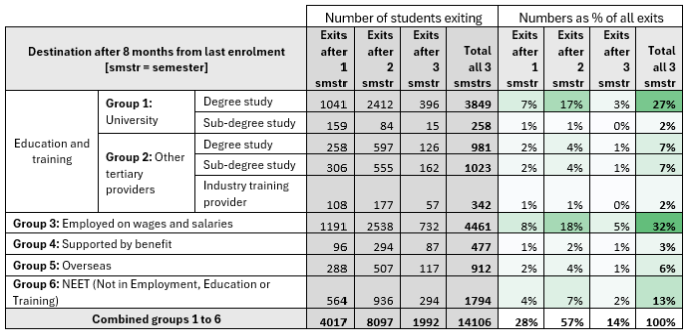
Table 2 indicates students were far more likely to exit at the end of their first full year of studies (after two semesters) – particularly if they were changing university or going into full time work.
Exit rates compared with academic preparedness and academic achievement
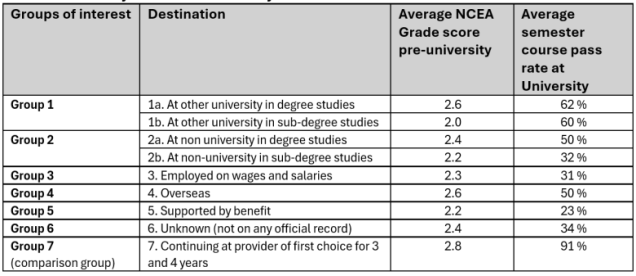
We tracked students who did not exit. These were students who continued at their first-choice provider for 3-4 years. On average, these students started university with an average NCEA Grade score of 2.8[1]. The average course pass rate for these students was 91% of all credits attempted during their studies – i.e. if they enrolled in ten papers, they passed nine of them.
These students are shown as ‘Group 7’ in the table below.
It is notable that ‘Group 7’ students started university with better NCEA grade scores overall and had substantially better average course pass rates than every other group of students.
Table 3: Secondary school and university attainment
For the students who exited, however, there is no actual data that records their reasons.
It is possible that a number just decided that university was not for them. Students in groups 2b, 3, 5, and 6 came into university less academically prepared and ended up with average pass rates below 40%. But we don’t know more than that. Some may have just not enjoyed university or faced obstacles in during the journey. Some may have struggled with a learning environment less structured than the school they had come from. Some may have struggled academically and just decided it was too hard. We just don’t know.
However, there are some patterns we can see in the data.
Certificate of Proficiency (CoP) programmes are typically taken by students who are not sure what programme to enrol yet or want to strengthen the level of academic preparedness necessary for academic success at university. Students who took these programmes were less likely to continue into first year studies. CoP students were 3% of all students entering university, but 9% of all the students exiting.
Some students did not continue in their original “speciality” programme. Speciality programmes are competitive entry programmes like law, engineering, or medicine. These subjects take in more students in first year than they admit to second year. Admission to second year is competitive and dependent on academic achievement. Of all the students who exited their first university 29% (n=1,116 of 3,849 across the five cohorts) had been in these specialty programme.
And/or returning home appears to have been a factor for some students.
Of the 14,106 students who exited their first university, 6,969 (49.3%) travelled away from their home region (where they went to school) to start university in a different region.
6,366 students continued education or training – with 4,110 enrolling at another university. Of those 4,110 just 5.5% enrolled in a field of study that had not been available at their first university.
Table 4 below shows the 6,366 students who continued with education or training after exiting their first university.
Table 4 – where students continuing education or training moved after their first university.
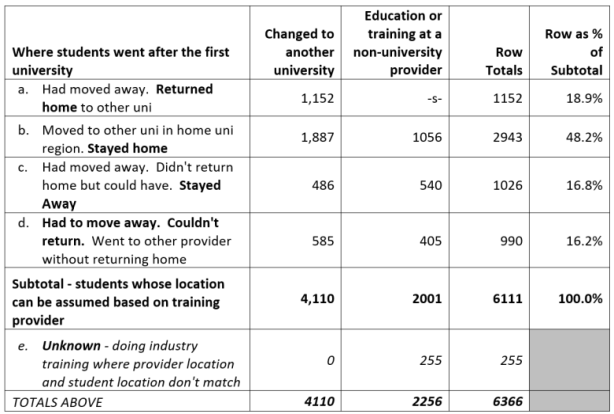
For all but the 255 people who were doing industry training after leaving their first university we can see where people moved based on the physical location of their education and training provider. For the people doing industry training the national training provider is typically in a different physical location to where the student is doing their actual apprenticeship or other form of workplace based learning.
2,178 (totals of rows (a) and (c)) of the 6,111 (36%) had moved away from a region with a university to attend their first university in another region. Of that 2,178, (or 53%) returned to their home region to continue university studies.
2,943 (total of row (b)) of the 6,111 (48.2%) had not left their home region to go to university, but transferred to another university also in the home region.
There is no publicly available information to explain why students took decisions such as moving away for their first university and then returning home for their second university, or why students changed from one university to another university in their home region.
What were the 32% who went into employment actually doing (Group 3)?
We know that 5,028 (32%) of those who left university over the years 2015 to 2019 were in employment eight months after graduation.
75% of these 5,028 people were in occupations requiring a high school qualification only – more than 98% earning less than $50,000 annually. The top five occupations were:
Top five occupational classifications for those in employment 8 months after leaving university
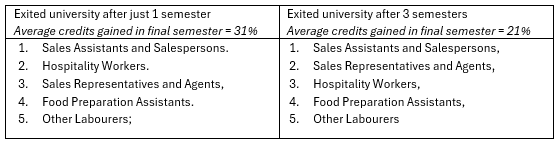
Table 5 below compares paid work hours for continuing students with students who exited university and went working. Work hours are estimated using tax records. Work hours are based on annual reported earnings divided by the industry’ wage for young people with no qualifications to get an estimate of the average hours worked in an average week.
Table 5: Estimated hours in paid work for continuing students versus the 38% of students who exited university to go working.
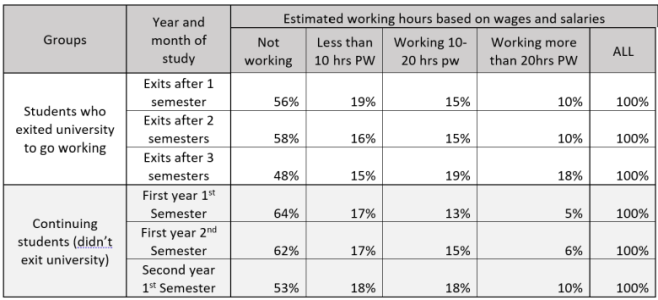
Although students who exited university to go working were more likely to be already working and, if so, working more hours on average than continuing students, the percentage differences are not that marked. It is notable that more than half of the students who left university to go working were not in taxed employment before they exited.
Policy take-aways and questions
Universities have two roles with regard to their students – one well understood and one not so well understood. The understood role is that of educating, developing, and supporting students to successfully complete qualifications.
The less well understood role is that, although we put support around our students to about the same level that a good employer puts around their employees, we also filter out students who cannot or will not meet the standards expected of a graduate, or who cannot or will not organise themselves to meet deadlines and be responsible for their academic performance.
It is OK that some students start but do not complete a qualification. Some students struggle academically or do not enjoy university life. Some are forced to make choices when they are unable to gain entry to limited entry programmes. Some students change their minds about what they want to study or where they want to study.
However, until we completed this work, we just didn’t know where exiting students were going. The evidence in this paper raises policy questions in a couple of areas.
Question 1: Are we measuring and rewarding universities for the right things? The Tertiary Education Commission funds tertiary education organisations (TEOs) – including universities. They use Education Performance Indicators (EPIs) as a mechanism for monitoring TEO performance and ensuring TEOs are delivering to expected standards. The three relevant EPIs for universities are:
- First year retention rates – the proportion of students who complete first year and progress to second year (78% for universities in 2023)
- Course completion rates – the proportion of students who complete the courses they attempt (88% for universities in 2023)
- Qualification completion rates (66% for universities in 2023).
The EPIs are built on an implicit assumption – that students going to university for the first time have made the correct choice in institution, location, subject. It also assumes that the students will want to remain at university once they have tried it and that they will continue to prioritise university studies over other possible life choices such as working, or going abroad. They also assume that students who meet academic requirements for entry to university will do their part and apply themselves to participate in their studies and to meet standards required for gaining a qualification.
Is it time for a better or more balanced set of metrics for assessing TEO performance?
Question 2: Are we doing enough to support the students who continue with education or training at another institution? We know from a separate UNZ study that 16% of students who enrol at a university have done previous studies at a tertiary institution within the past ten years and gained credits in the same field of study at the same or a lower level on the qualification framework. However, only 6.5% of that 16% are actually granted credit when they re-enrol.
As a country are we doing enough to ensure that students are gaining credit (avoiding having to do additional courses and pay additional fees) when they exit from their first university and re-enrol at a second university?
[1] NCEA Grade score ranges from 0 to 4, where values 0-2 indicate the average achievement on NCEA standards between ‘Not achieved” and “Achieved”, values between 2-3 indicate the achievement level between “Achieved” and “Merit” and values 3-4 indicate the level of achievement between “Merit” and “Excellence”.