Degrees of change
07 October 2020 | news
It’s an unusual month where there isn’t a commentator quoted somewhere saying something like; “degrees are a waste of time”, or “degrees just won’t matter as much in future”.
These statements often get quite a bit of publicity but are rarely more than someone’s opinion. 
With the (long delayed) publication of Census 2018 results late in 2019, it’s useful to see what’s actually happening across New Zealand. Are people turning away from degrees? Are they still worth the time and money?
First, a couple of caveats about Census data.
It’s not always accurate. People completing a census form may exaggerate their qualifications, job titles, earnings, etc. People may also prefer to not provide an honest answer as to how they make their living. For example, the 2013 Census was the last time someone could self-identify as a sex worker, and if the Census results are to be believed, there were only six people making their living that way in that year.
To make the Census data useful, Statistics NZ have to take a range of answers to questions like ‘job title’, or ‘highest qualification’ and fit them into standard job titles or standard qualifications. Someone who is a qualified professional engineer designing machinery and a person maintaining the same machinery can all have end up being classified as a ‘mechanical engineer’. This is why just 32% of the 2256 ‘mechanical engineers’ in the 2018 Census have a degree-level qualification; 582 have no post-school qualification at all; and 141 have a masters or doctorate qualification.
It’s not always clear what the numbers are telling you. For example, in 1996 none of New Zealand’s pig farmers had a degree. In 2018, all of them had a degree.
So, let’s look at some headline longitudinal information to show how things are changing over successive censuses.
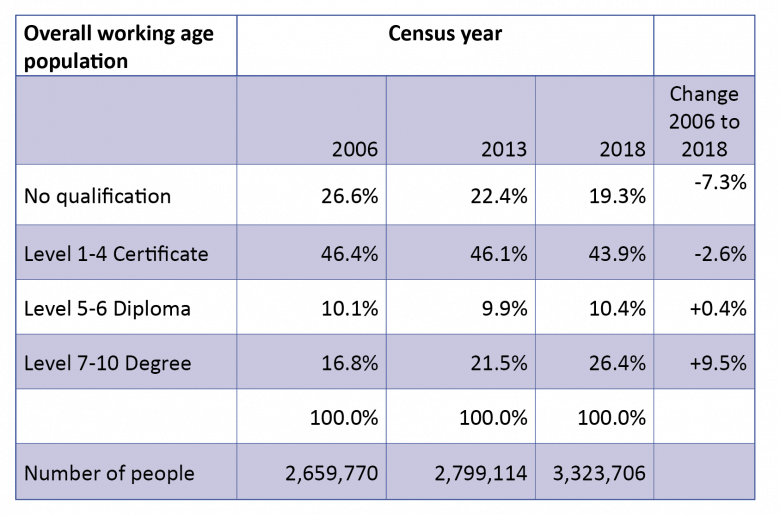
First, the 2018 Census continues a long-term trend showing the population getting more and more qualified. This is seen in the table below where the proportion of the population with a degree-level qualification has increased from 16.8% in 2006 to 26.4% in 2018. Around 38% of young people start university within a few years of leaving school, so that percentage will continue to climb as younger qualified people enter the workforce and older, less qualified workers retire.
In the next table, we can how the percentage of jobs is changing across different sectors of the New Zealand economy where:
- Absolute Change is comparing the number of jobs added or reduced without any adjustments
- Real Change is adjusting increases or decreases in numbers of jobs to account for growth in population
- % of workforce in each sector shows what proportion of NZ’s workforce was employed in that sector in 2006 and 2018.
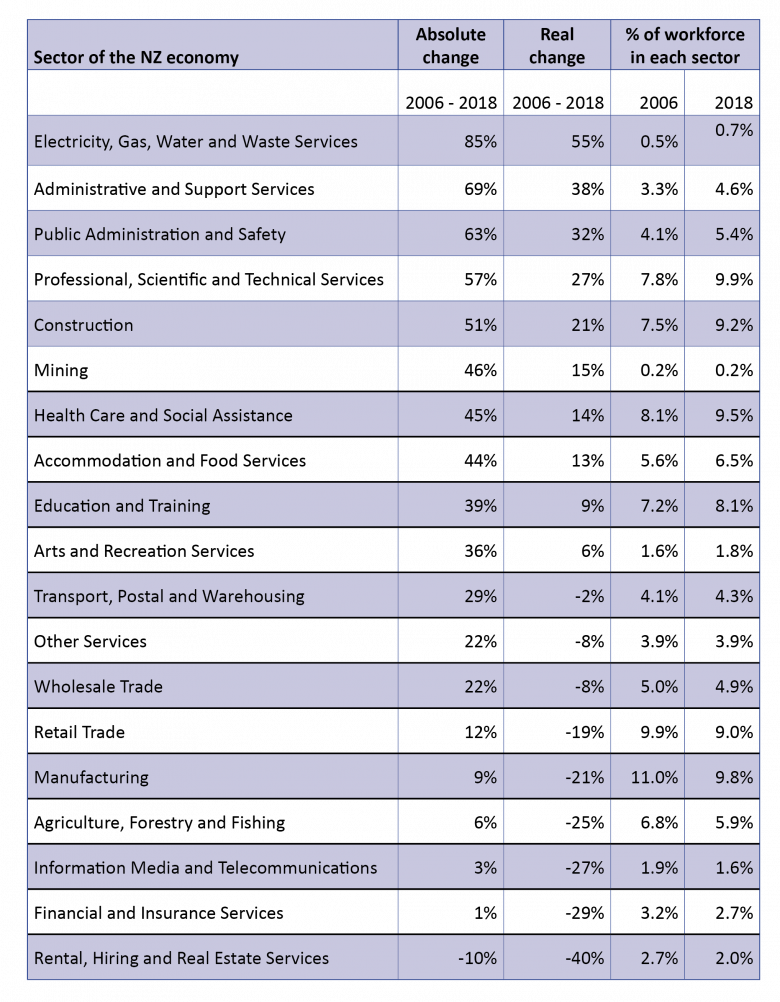
Sectors like utilities (electricity, gas, water, etc), administration and support services, and Government all showed significant absolute and real growth. Sectors like rental, financial, insurance, media, and telecommunications all showed decline—presumably largely as a consequence of technology and automation.
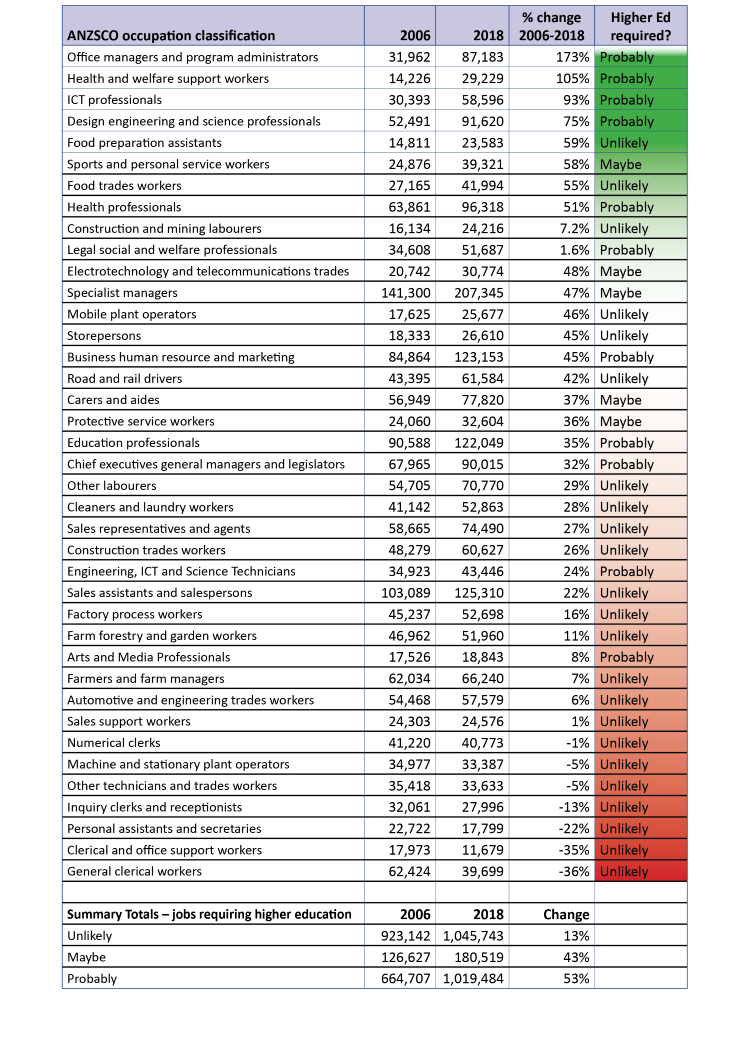
The table below shows changes in the number of people in broad job categories between 2006 and 2018. The column on the far right indicates which are more likely or less likely to require a significant amount of post-school education—at least two or three years of further study.
You will see that the job categories that are growing are more likely to require post-school education and those in decline are more likely to be those you can do direct from school.
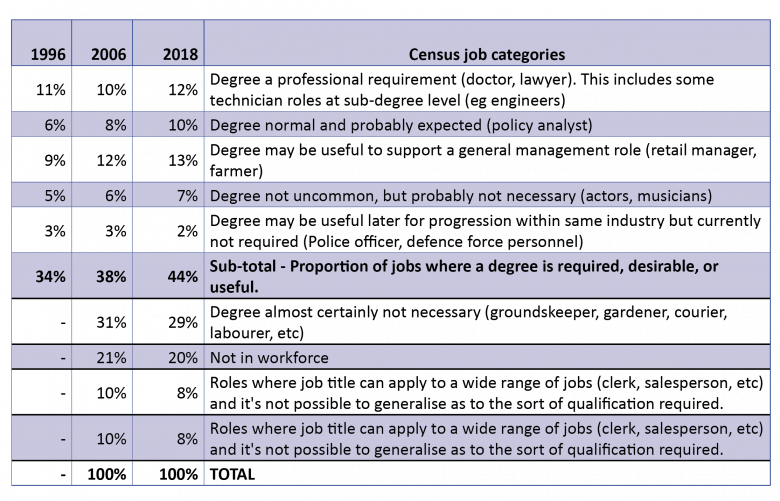
We then looked at three Census years (1996, 2006, and 2018) and classified the responses of everyone aged 15-65 into one of eight categories. Note that changes in reporting methodology mean that some data cannot be consistently reported for 1996 against later years. This is why some cells are missing data below.
You can see in this table a slow steady increase from 34% of jobs in 1996 either requiring or potentially benefiting from a degree level qualification, rising to 44% in 2018:
Finally, we used the same exercise to see how many people had a degree and were working in jobs with job titles which, on the face of it, probably don’t require a degree—such as receptionist, personal assistant, postal worker, etc:
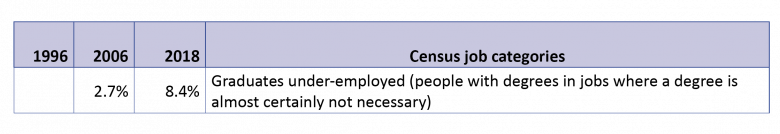
It is not clear why there is such a significant difference between 2006 and 2018, but the increase may be partly due to differences in the employment cycle – with 2006 being just before the Global Financial Crisis of 2007. It may also be partly due to more people feeling they need to get a degree.
So, 2018 confirms an ongoing trend towards a knowledge economy that requires a higher skilled workforce and a workforce that is progressively becoming more skilled in turn.