Does it do what it says on the packet?
31 October 2018 | news
How do NZ universities ensure the courses they provide meet the needs of their students and ensure they are capable and employable? 
Every NZ university has strong internal systems to ensure that students receive quality education. And the system as a whole tests and supports these systems.
Details vary from university to university, but common features exist. All New Zealand universities:
- have academic quality units and Learning and Teaching committees to inform the development and adoption of everything from online learning platforms to teacher-training for new academics
- include expectations on teaching competence in employment contracts or position descriptions for academics
- provide training for academics new to teaching. It is mandatory at two universities and strongly encouraged at the other six universities, by linking teaching performance to pay increases and promotion. All universities also provide refresher courses.
- formally assess competence in teaching, assessment and curriculum development through regular (typically annual) performance reviews. Assessing competence relies on independent evidence, including the results of student evaluations and teaching evaluations.
- survey students to make sure they’re satisfied with teaching and their courses, as well as with the wider academic and extra-curricular environment. Results are reported in annual reports and show average satisfaction rates at over 80% (about the same as the average for Australian universities). These satisfaction rates have increased at all universities over the past 15 years, and surveys are fed into annual performance reviews and promotion applications for academic staff.
- survey their international students using the International Student Barometer survey. On average, 87% are satisfied with their overall learning experience (in-line with the global average) and 94% are satisfied with the subject area expertise of their teachers.
- ensure course and qualification completion rates are in line with international norms. Average course completion rates are 86% and average qualification completion rates are 80%.
If an academic has teaching responsibilities, and most do, universities require them to demonstrate their competence in teaching, assessment and curriculum development as a condition for promotion.
National tracking
Nationally, the university system tracks and supports teaching quality through:
- the Committee on University Academic Programmes (CUAP), which ensures that all qualifications have a graduate profile likely to lead to good employment and other outcomes; a curriculum likely to develop students in line with the graduate profile; and teachers with the skills and qualifications needed to deliver the curriculum. CUAP surveys graduates and employers to verify that universities have delivered what they promised.
- the Academic Quality Agency (AQA), which independently audits each university academically. The most recent round of audits carried out between 2013 and 2016 included six expectations on teaching quality, and found that all universities had strong policies, practices and systems to ensure, support and reward high-quality teaching.
Separately, universities and the Tertiary Education Commission track teaching outcomes through a range of metrics, including:
- non-completion rates—ours are among the lowest in the world (17% after eight years compared with 26.4% for Australia, 41% for the US and around 50% for much of Asia and countries like Chile, Colombia & Brazil in South America).
- employment rates—typically 97-98% for NZ university graduates, in line with countries like the UK, US, and Australia.
- under-employment rates—ours are about 11%, ie, around 89% of degree holders in New Zealand are employed in jobs where a degree is either expected (doctor, teacher, etc), or probably useful (retail manager, farmer, etc). This compares with under-employment of 33% in the US 10 years after graduation.
The overall quality system has seen a steady rise in student rating of teaching and/or courses to an overall 84% average satisfaction. This can be seen in the following table where results from the eight universities have been presented in a standardised way.
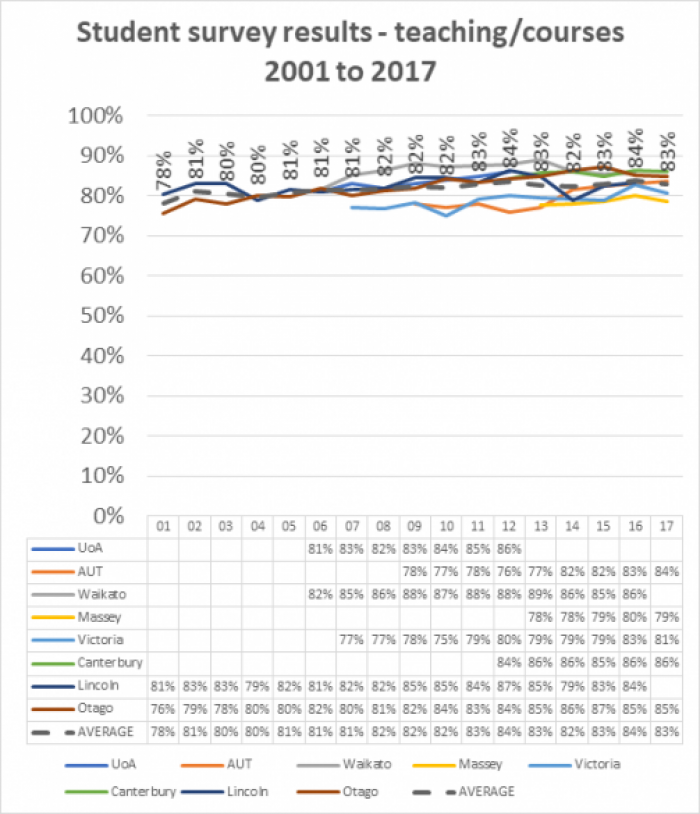
Note that each university surveys students on different things—such as satisfaction with courses, or satisfaction with teaching quality—so results are not perfectly like for like.