How doctorates tip the scales in a student's favour
13 June 2022 | news

New Universities New Zealand – Te Pōkai Tara analysis debunks the myth that most people who invest time and money in a doctoral degree end up under- or unemployed.
On the contrary, the analysis shows doctoral degrees to be a sound investment, with better on average employment rates, earnings and qualification-relevant employment than for any other qualification.
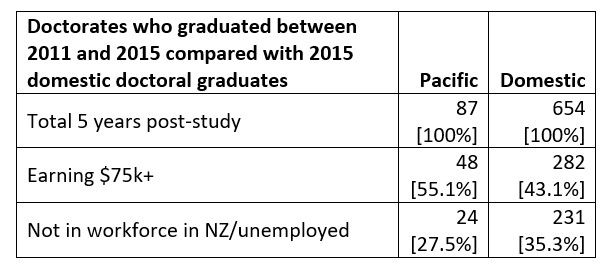
There are particularly good earning outcomes for Māori and Pacific peoples with doctorates – significantly better than for other ethnicities.
The analysis also scotches the misconception that people with doctoral degrees are mainly to be found teaching in universities. Universities, in fact, produce three to four times more doctorates than they employ themselves. Most people with doctoral degrees work outside academia, using their skills and expertise to benefit a wide range of other professions.
University New Zealand's analysis is based on a new resource on our website to help researchers better understand the value of PhDs and other doctorates to the people who get them and to society generally.
The resource contains a large amount of the information held in Stats NZ’s Integrated Data Infrastructure on people with doctoral qualifications, which include PhDs and ‘named doctorates’ such as a Doctor of Clinical Psychology or a Doctor of Fine Arts.
The evidence shows a lot of people are doing doctorates. Overall domestic student enrolments (at all levels) in tertiary education increased by 15% between 2000 and 2020 while domestic doctoral enrolments increased by 50%. (See the tables at the end of this article for numbers.)
Doctoral enrolments for Māori increased by 157% over the same period and Pacific enrolments by 394% – 7.6% of domestic doctoral students were Māori in 2000, whereas by 2020 this had risen to 11%; 2% of domestic doctoral students were Pacific in 2000 and this had risen to 5% by 2020.
So a greater number of people are getting a doctorate. Is that a good thing?
At the last Census, in 2018, 29,871 people reported they had a doctorate. Most were under 69 (25,455); some had come to New Zealand as international students and earned their doctorates here.
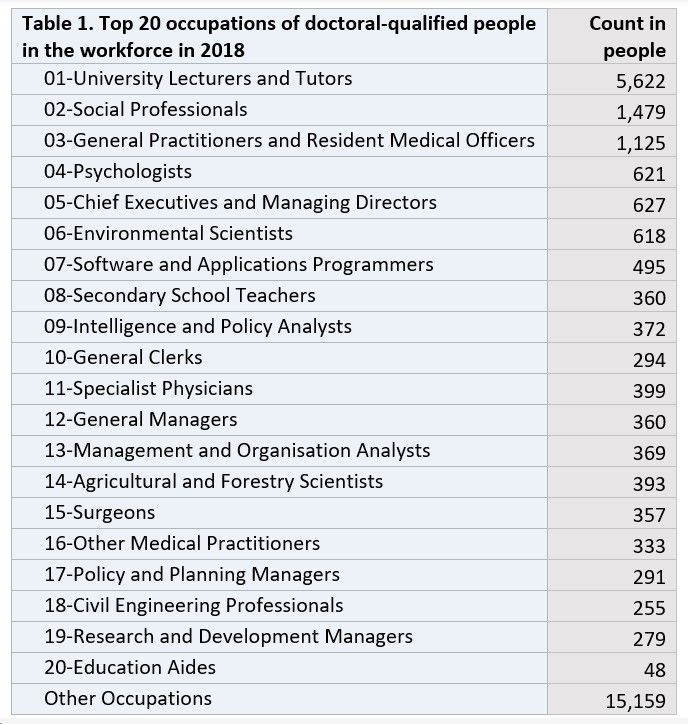
Top occupations in 2018 for all 29,871 people were reported as follows in Table 1. Note that both occupations and qualifications are self-identified by people filling out the Census form, so there is probably some over-counting of doctorates (particularly in roles such as General Practitioners and Resident Medical Officers, who mostly have level 9 [Master’s] level qualifications).
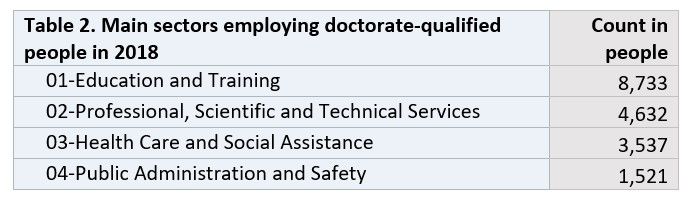
Almost three-quarters of those with a doctorate at the time of the last Census were employed in just four sectors.
Nearly all people with doctorates were employed in 2018. Typically, less than 1% of recent doctoral graduates are on Jobseeker Support at any given point in a year.
Table 3 shows that, in addition to enjoying comparatively high employment rates, doctoral graduates on average will earn about $2 million more during their working lives – noting that this average is skewed towards some disciplines. Yes, there are some fields such as law and architecture where those with a doctorate earn on average less than practitioners mostly working in industry, but that is because a significant proportion of those with a doctorate work in academia.
Table 3 – Earnings over working life for each qualification above people with just a school education (after accounting for time out of the workforce to study, student loans and student fees)
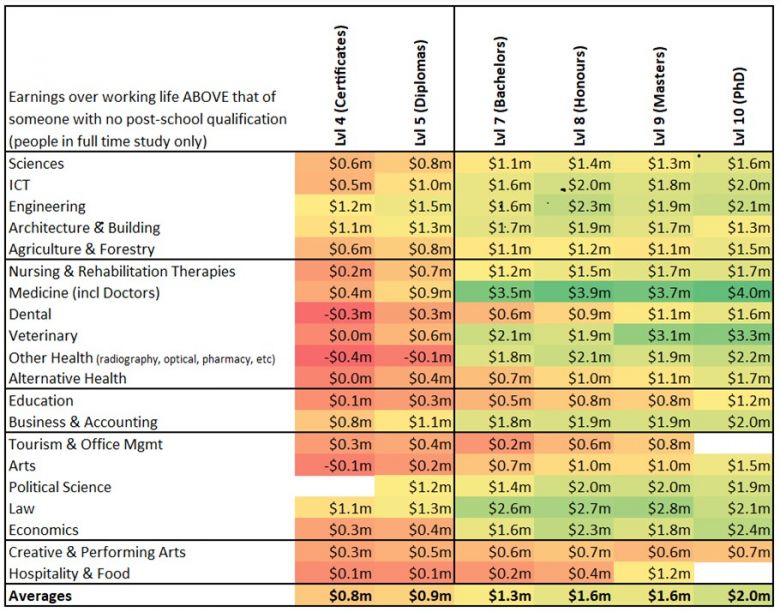
There is additional information on people with a doctorate in Table 4, which breaks down some of the broader categories in Table 3. For example, Table 3 shows averages for graduates in the Sciences, whereas Table 4 breaks these down to Mathematics, Physics & Astronomy, Chemical Sciences, Earth Sciences, Biological Sciences and Other Sciences.
In general, Table 4 suggests most people with a doctorate appear to be employed in areas relevant to their qualification. This is particularly the case for doctorates in STEM subjects.
Table 4 – Detailed information on doctorates by field of study
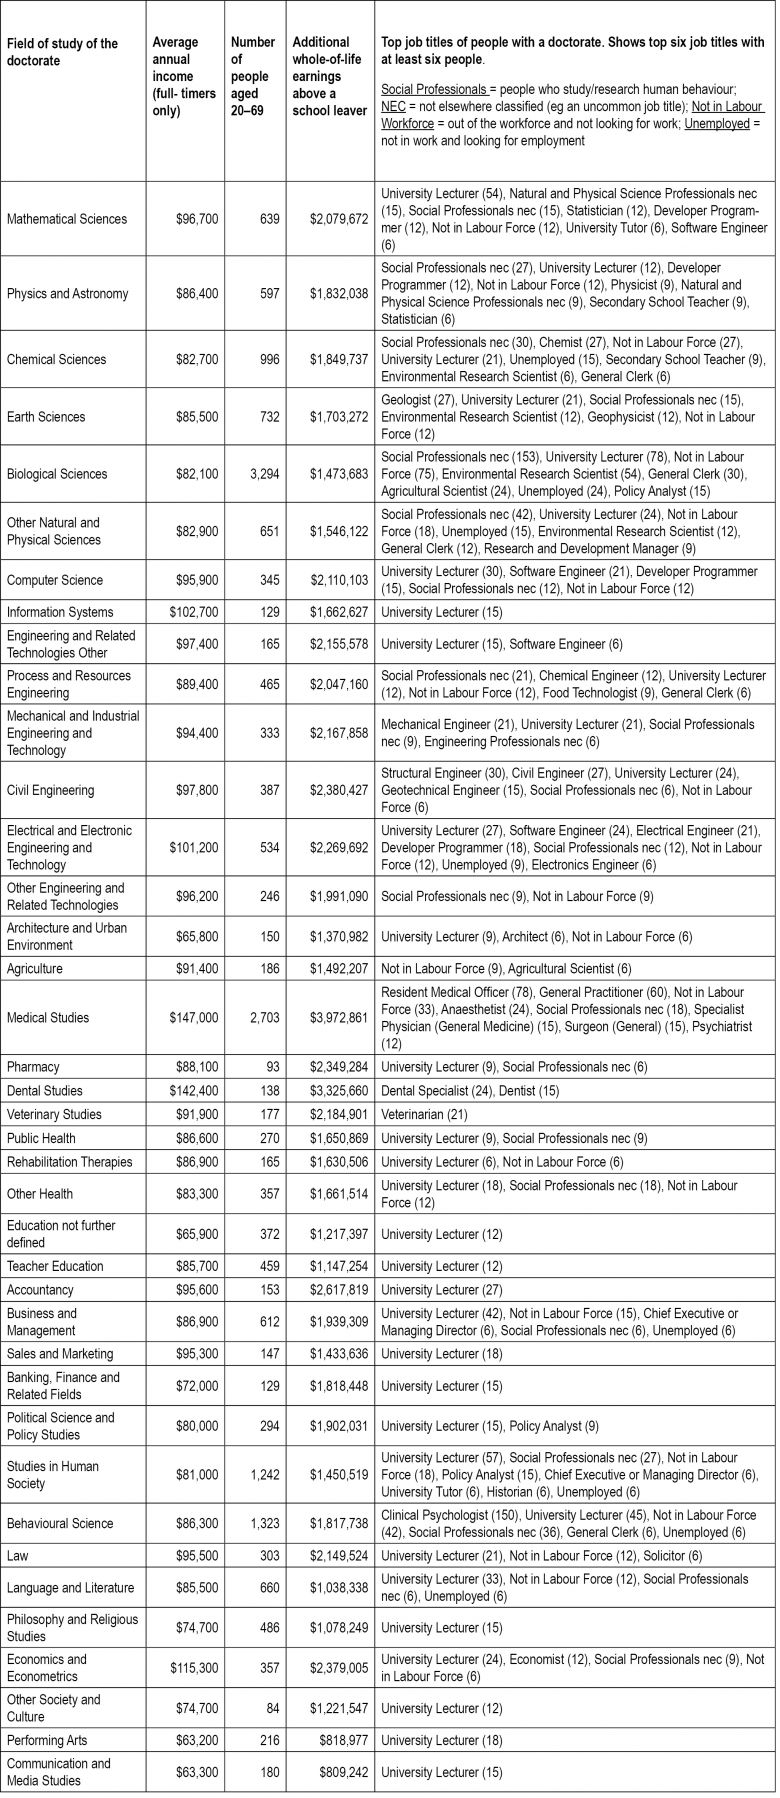
Table 5 – Outcomes for doctorates who graduated in 2015 five years later
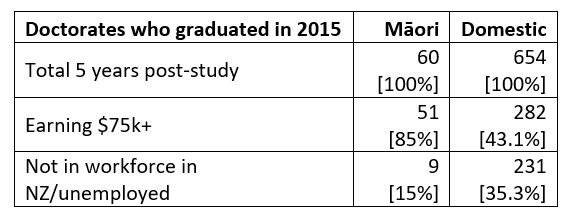
Table 6 – Outcomes for Pacific doctorates who graduated between 2011 and 2015 five years later
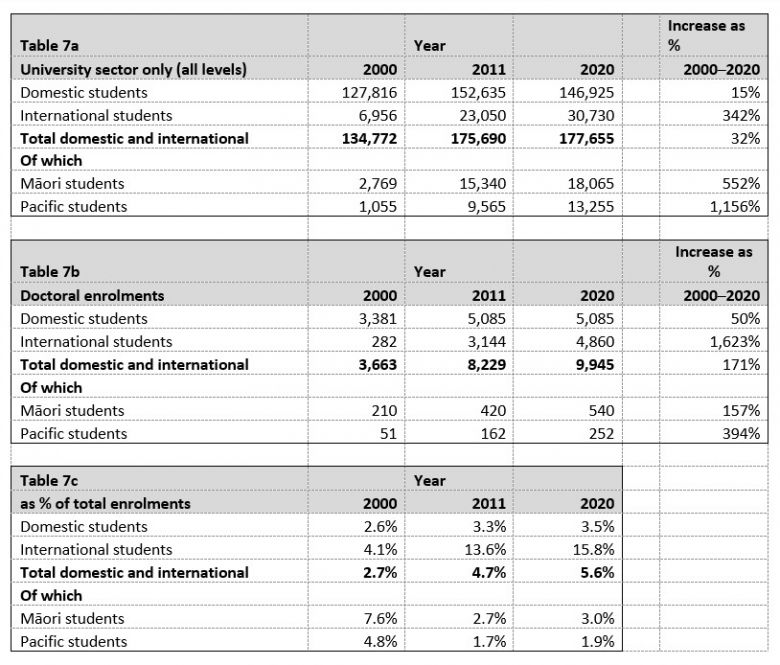
In reading table 7c, note that the proportion of Māori and Pacific in overall doctoral numbers has increased relative to overall domestic student numbers, but has decreased when international student numbers are taken into account. This is a consequence of a massive increase in international student doctoral enrolments since 2006 when tuition fees for international doctoral students were reduced to match domestic student tuition fees.