What happens to international students who remain in New Zealand after getting a degree?
03 August 2021 | news
Do most of the international students who remain in New Zealand after completing degrees end up driving taxis or working as cleaners and baristas?
UNZ has looked at linked data from the 2018 Census and the Integrated Data Infrastructure to see whether this popular view is grounded in fact.
Focusing mainly on international students who gain a degree in New Zealand, we tried to answer four questions:
- Who remains in New Zealand after they graduate?
- Where do they end up working?
- What are they doing? How many are in degree-level employment?
- What does the journey look like for these graduates?
We found that—although some degree-qualified international graduates are doing those sorts of jobs—they are the exception. For each ‘under-employed’ international graduate, nearly ten others are working in skilled, degree-level jobs.
Who are we talking about?
The Census is the only New Zealand dataset that contains all the job titles that people are employed under.
For most of this paper we have looked at domestic and international degree-level graduates aged 24-39 at the time of Census 2018. These were reasonably recent graduates, having gained a degree-level qualification from a NZ tertiary provider, with at least two years’ working experience before Census 2018 and who were employed in New Zealand. This is 103,000 domestic graduates and 16,700 international graduates (see Appendix 1 for definition of study groups). Average age for domestic graduates was 29, and 31 for international.
We also focused mainly on people in full-time employment at the time of Census 2018. There are many reasons why graduates might be in part-time work (such as taking time out to raise a family) and this information is not available in the datasets, making it difficult to account for different graduate outcomes.
Who stays after graduation?
Nearly half of all international students leave New Zealand immediately after completing their degrees. Of the remainder, some stay to travel and work for a period before leaving the country, and a smaller proportion remain here long term.
Immigration settings have changed several times over the past decade, but since 2018 any international graduate with a level 7 (bachelor’s) or higher qualification has been automatically eligible for a Post Study Work Visa, allowing them to stay in New Zealand and work for up to three years. They can then apply for another, non-Post Study Work Visa if they wish to remain after that.
We looked at international students who graduated from a New Zealand university between 2010 and 2014 and followed them for 5 years after graduation. There were 7,110 international university graduates over that period. Of these, 3,213 (45%) left New Zealand immediately after completing their studies and 3,897 (55%) remained in New Zealand after graduation.
Of the 3,897, the four most common pathways (covering 75.8% of the students) were:
- 5 % remained on Post Study Work Visas and later transitioned to another skills-based visa (essential skills or skilled migrant categories)
- 2 % did not get a visa after their Post Study Work Visa and departed New Zealand within three years of completing their studies.
- 5% gained Visitor’s Visas after studies, suggesting they extended their stay primarily to travel before departing.
- 6% gained a Post Study Work Visa and then formed a relationship that allowed them to remain in New Zealand.
Figure 1 below illustrates the visa pathways for international graduates from universities, 5 years post study.
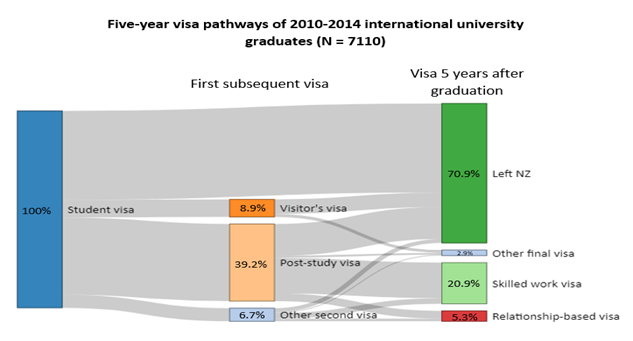
Notes: Percentages are calculated on rounded counts. Source: Universities New Zealand, extracted from Integrated Data Infrastructure (IDI). Population is restricted to university graduates.
The top 10 occupations when applying for skilled migrant visa categories for international degree graduates from universities were: (1) Resident medical officer, (2) Accountant, (3) Early Childhood teacher, (4) Retail manager, (5) Café or Restaurant manager, (6) Marketing Specialist, (7) ICT customer support officer, (8) Secondary school teacher, (9) Developer programmer and (10) Software engineer. These occupations were the basis of 36% of all approved skills-based work visa applications for our study population.
Does working while studying affect the proportions who remain and work after graduating?
Earlier this year, UNZ published analysis that showed that, while 81% of domestic students work while they study, just 37% of international students do the same.[1]
By contrast, of the 3,897 (55%) of graduates who remained and worked in New Zealand after graduation, 81% had been in some sort of paid employment during the final year of their studies.
This suggests that working while studying makes it far more likely that international graduates will remain to work in New Zealand after graduating.
Figure 2 shows all 16,707 degree-qualified international graduates who remained in New Zealand after graduating and who were still here at the time of the 2018 Census. The proportion who worked and did not work is shown on the left with, on the right, those who were in full-time employment, part-time employment or were not in employment, education or training (NEET).
Figure 2: Employment status in the year of degree completion and at the time of Census 2018
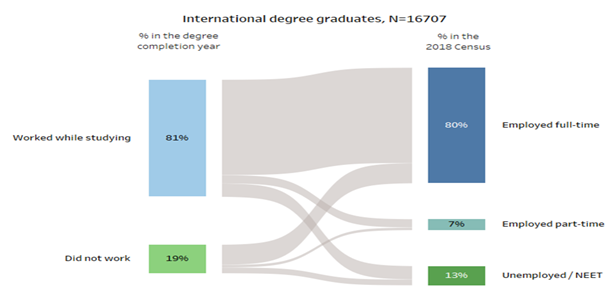
Notes for Figure 2: Percentages are calculated on rounded counts. Source: Universities New Zealand, extracted from Integrated Data Infrastructure (IDI).
Figure 3 below starts to indicate the sort of journey graduates go through after graduation—where a proportion initially try to get work wherever they can and then, over the ensuing 2-3 years, work themselves into jobs more appropriate to their qualification and skills.
Figure 3 shows in which sectors domestic and international degree-qualified graduates were working in the first year after graduating and which sectors they were in at the time of Census 2018. These are people who graduated between 2008 and 2016—so between two and ten years between entering the workforce and Census 2018.
You can see that, for example, 20% of all international graduates started their employment in the accommodation and food services sector, but only 7% were still in that sector by Census 2018.
Figure 3: Employment industries in the degree completion year and at the time of Census 2018
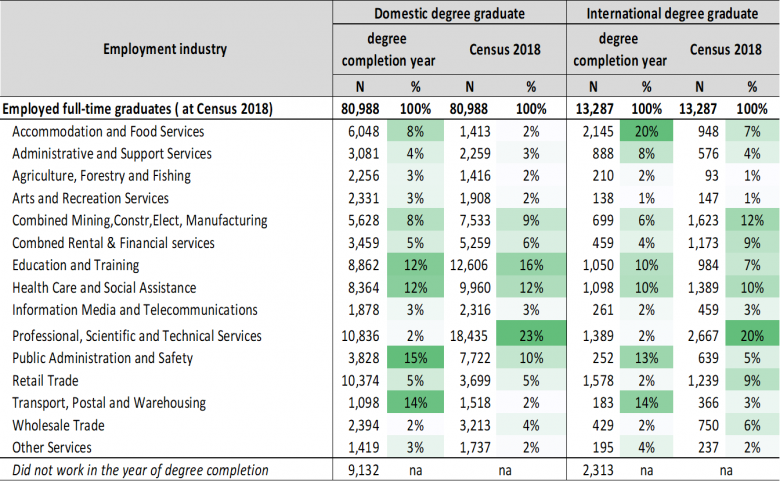
Notes: Percentages are calculated on rounded counts. Population is restricted to full-time employed people at the time of Census 2018. Source: Universities New Zealand, extracted from Integrated Data Infrastructure (IDI).
Figure 3 shows a fairly consistent shift for both domestic and international graduates from early employment in sectors which generally pay less and typically employ fewer degree-qualified workers to later employment in sectors typically associated with a more skilled workforce and better remuneration.
The fact that international graduates appear over-represented in sectors such as ‘accommodation and food services’ is not surprising, given this is the main sector where international students find employment while studying. A third (32.6%) of the international students who work while studying work in this sector. The next largest sector that employs international students is ‘education and training’ at 17.9%, followed by ‘retail trade’ at 16.1%.[2],[3]
Movements between industries are complex, with graduates transitioning between (almost) every pair of industries during and after study. To illustrate the transfers, we chose the largest industries during and post study. Figure 4 demonstrates flows from Accommodation and Food Services (where 20% of international graduates were employed as students) and Figure 5 shows flows into Professional, Scientific and Technical Services (where 20 % of international graduates were employed post study). In each case, the largest subgroup does not move, but approximately three quarters of individuals move to or from a different industry.
Figure 4: Industries of employment for international degree graduates who worked in Accommodations and Food Service industries as students (N=2,145)
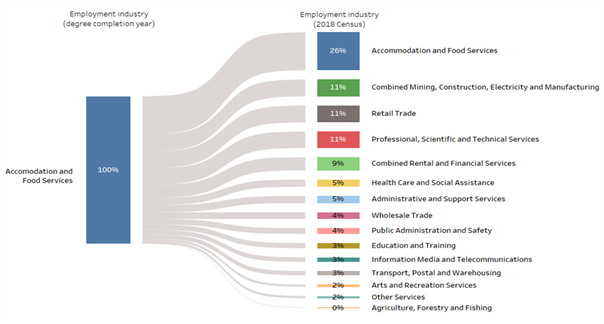
Figure 5: International degree graduates working in Professional, Scientific and Technical Services industry and their industries of employment as students (N=2,667)
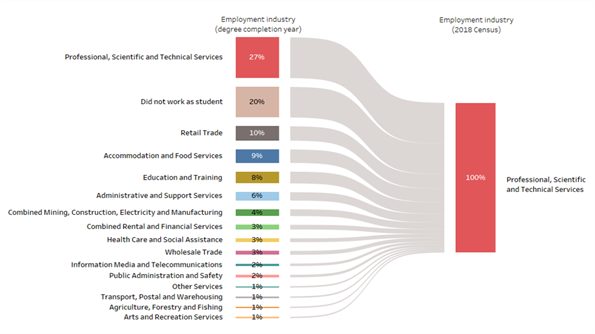
Notes for Figure 4 and 5: Percentages are calculated on rounded counts and we combined some industries for this analysis. Population is restricted to full-time employed at the time of Census 2018. Source: Universities New Zealand, extracted from Integrated Data Infrastructure (IDI).
What do international graduates end up employed as?
We looked only at domestic and international graduates who were reasonably recent graduates aged 24-39 at the time of Census 2018 (having gained a degree-level qualification 2-10 years before Census 2018) and who were working full time in New Zealand. This is 81,054 domestic graduates and 15,207 international graduates.
Figure 6 shows that international graduates are more likely than domestic graduates to be employed under job titles that, if correct, suggest they may not be in degree-level employment. 15.7% of international graduates and 9.5% of domestic students reported these sorts of job titles. The ten most common job titles for degree-qualified international graduates are shown below (largest to smallest) along with what percentage that number represents of the 15,207 graduates.
Figure 6 – The most common job titles of international graduates employed in occupations at ANZSCO Skill Level 5 (in occupations that require level 1 certificate or secondary school qualification)
|
Top 10 occupations at ANZSCO Skill level 5 |
# People |
% of 13,287 |
|
1. Sales Assistant (General) |
375 |
2.8% |
|
2. Labourer nec |
48 |
0.4% |
|
3. Commercial cleaner |
33 |
0.2% |
|
4. Cafe worker |
24 |
0.2% |
|
5. Security Officer |
24 |
0.2% |
|
6. Office Cashier |
21 |
0.2% |
|
7. Courier |
18 |
0.1% |
|
8. Commercial Housekeeper |
18 |
0.1% |
|
9. Kitchenhand |
15 |
0.1% |
|
10. Container Filler |
9 |
0.1% |
|
Totals for the 10 job titles above |
585 |
4.4% |
Notes: Percentages are calculated on rounded counts. Population is restricted to full-time employed international degree graduates at the time of Census 2018. Source: Universities New Zealand, extracted from Integrated Data Infrastructure (IDI).
For one degree-qualified international student whose job title suggests they could be under-employed there are nearly 10 other degree-qualified international students who have job titles that fall under ANZSCO skill level 1, suggesting they are degree-level skilled employment. The ten most common job titles for these people are presented in Figure 8 (most common to less common).
Figure 7: The most common job titles of international graduates probably in skilled degree-level employment (ANSZCO Skill level 1)
|
Top 10 occupations at ANZSCO Skill level 1 |
# People |
% of 13,287 graduates |
|
1. Accountant (General) |
747 |
5.62% |
|
2. Early Childhood (Pre-primary School) Teacher |
368 |
2.77% |
|
3. Sales and Marketing Manager |
350 |
2.63% |
|
4. Software Engineer |
341 |
2.57% |
|
5. Developer Programmer |
333 |
2.51% |
|
6. Systems Analyst |
272 |
2.05% |
|
7. Chief Executive or Managing Director |
242 |
1.82% |
|
8. Management Consultant |
213 |
1.60% |
|
9. Policy and Planning Manager |
211 |
1.59% |
|
10. Marketing Specialist |
204 |
1.54% |
|
Totals for the 10 job titles above |
3281 |
24.69% |
Notes: Percentages are calculated on rounded counts. Population is restricted to full-time employed international degree graduates at the time of Census 2018. Source: Universities New Zealand, extracted from Integrated Data Infrastructure (IDI).
Appendix - Methodological Information
We used linked data from the 2018 Census and the Integrated Data Infrastructure to look at post-study outcomes for international students who gain a degree-level qualification and remain working in New Zealand.
The study was based on graduates who were (a) aged 24-39 at the time of Census 2018; (b) reported in the Census 2018 that they had completed degree-level studies (bachelor’s, honours, master’s, or doctorate); (c) completed a degree-level qualification from a NZ tertiary education provider between 2008 and 2016 (2-10 years before the 2018 Census); (d) were still in New Zealand at the time of the 2018 Census; and (e) were in full-time work.
We chose these ranges deliberately.
- We did not include more recent graduates from 2017 or 2018 because we wanted to look only at graduates who had sufficient time to get into the workforce before the Census 2018.
- We focused on graduates in full-time work because there are many reasons why graduates might be in part-time work (such as taking time out to raise a family). These reasons are not available in the datasets, making it difficult to account for different graduate outcomes.
We are presenting a general trend only; results need to be regarded with a degree of caution and variations within the groups are expected.
Immigration policies and work-rights policies for international graduates changed several times over the period covered by this study. The outcomes for international students graduating today and entering New Zealand’s workforce would be quite different to those who graduated and entered the workforce a decade ago.
Census returns can produce errors or misleading results, and linkages between Census and administrative data are not 100% correct. People completing the census provide a job title in a free text field and census forms are then scanned. Optical character recognition and algorithms are used to assign most people to one of the standard ANZSCO job titles. Those who do not clearly fit into a job title are then evaluated by a person who makes a judgement based on the free text title provided. As such, the Census includes people who have been classified as Mechanical Engineers with no post-school education and others under the same title with postgraduate qualifications. Similar patterns are evident for a wide range of other job titles.
IDI Disclaimer
The results in this paper are not official statistics. They have been created for research purposes from the Integrated Data Infrastructure (IDI) which is carefully managed by Statistics NZ. For more information about the IDI please visit https://www.stats.govt.nz/integrated-data/. Access to the data used in this study was provided by Statistics NZ under conditions designed to give effect to the security and confidentiality provisions of the Statistics Act 1975. The results presented in this study are the work of the authors, not Statistics NZ or individual data suppliers.
[1] https://www.universitiesnz.ac.nz/latest-news-and-publications/are-intern...
[2] Universities New Zealand (2021), Working while studying. https://cdm20045.contentdm.oclc.org/digital/collection/p20045coll17/id/1165/rec/2
[3] Universities New Zealand (2021), Working While Studying: Longitudinal trends 2009-2019 presentation, https://cdm20045.contentdm.oclc.org/digital/collection/p20045coll17/id/1166/rec/8